Population Growth and
Water Consumption Trends in Queretaro
ACUEDUCT QUERETARO II
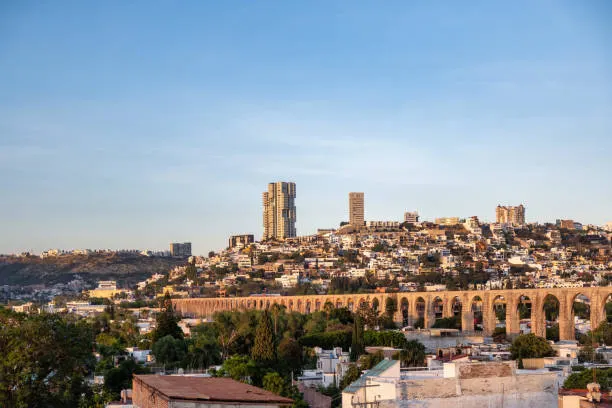
CITY OF QUERETARO
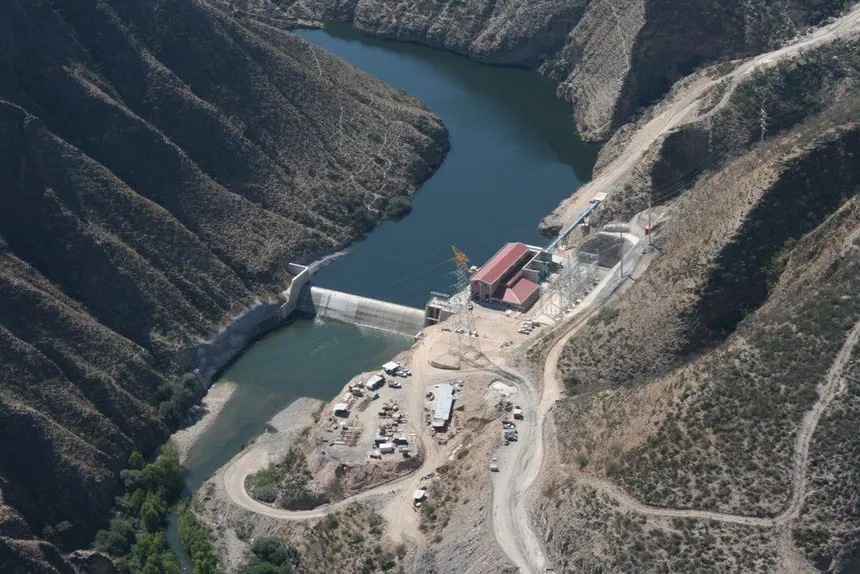
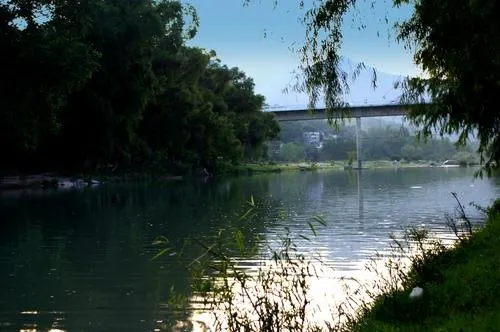
QUERETARO DAM
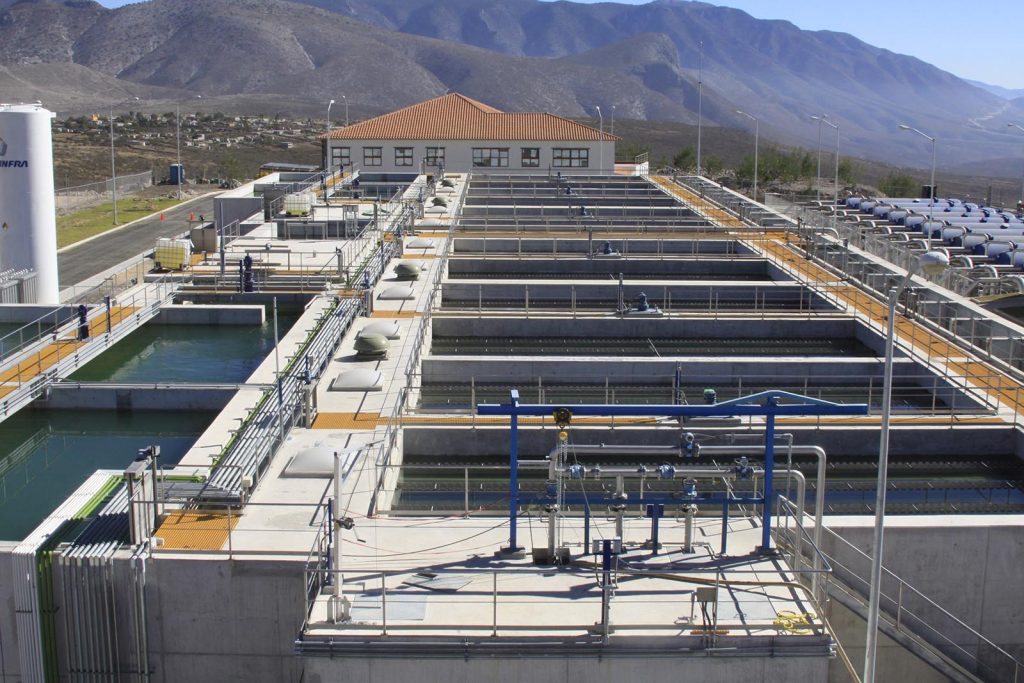
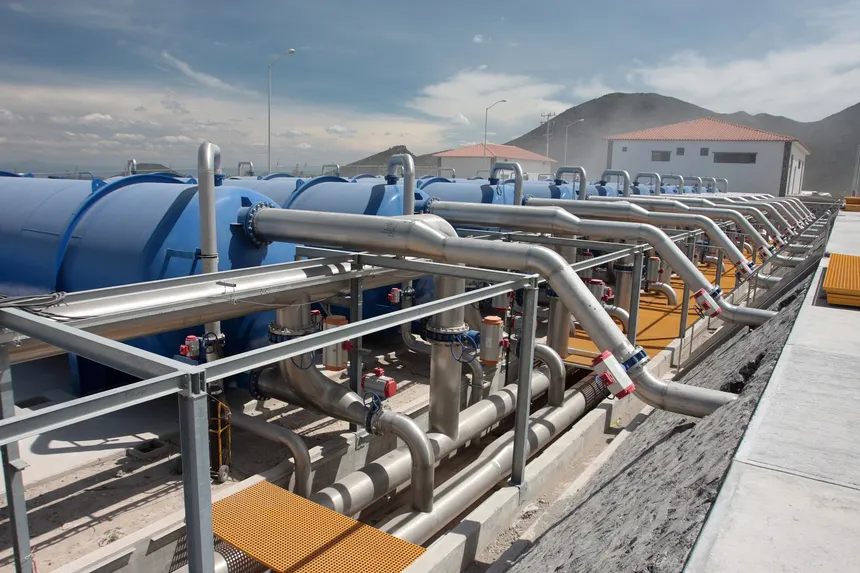
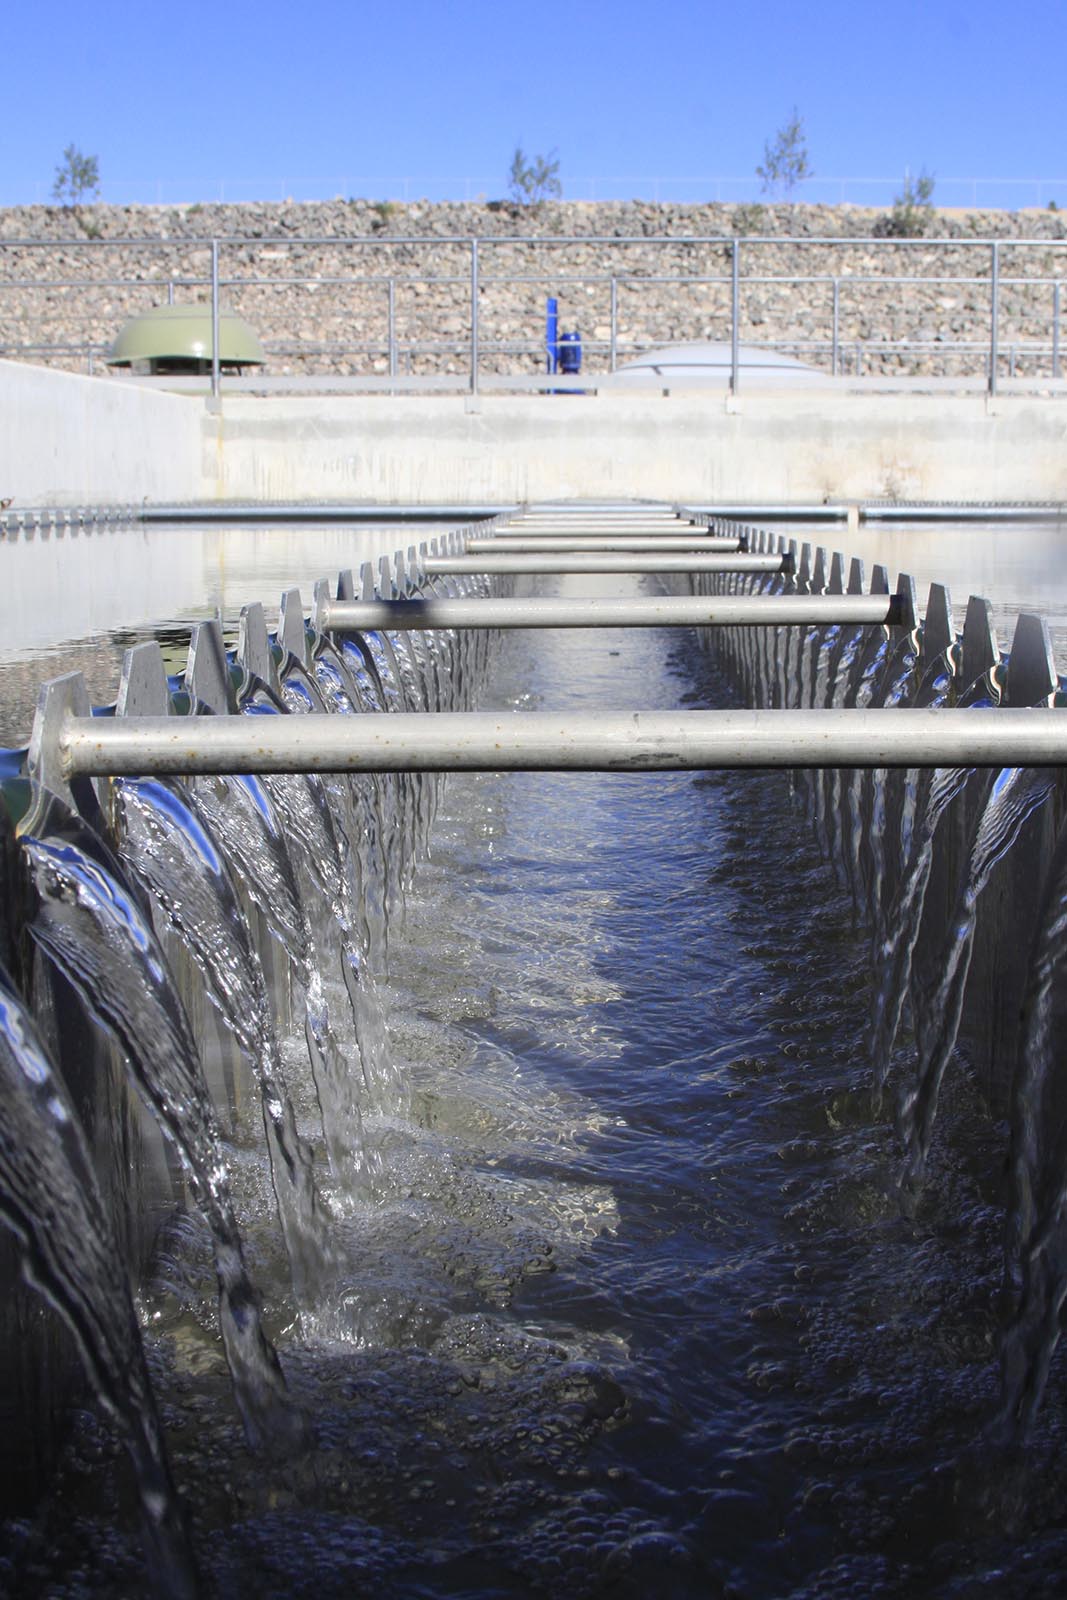
Water Treatment Plant
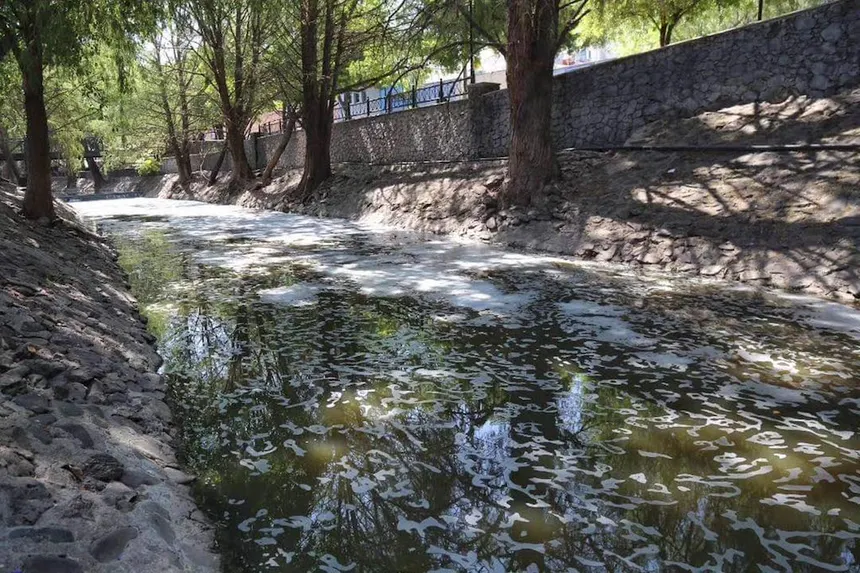
Problem Statement
Queretaro’s rapid population growth is intensifying pressure on water resources, with urbanization, industrial expansion, and rising residential demand driving unsustainable consumption trends. This project analyzes how demographic changes correlate with escalating water use providing data-driven insights to mitigate risks and guide policy.
We analyze two core datasets (1980–2020):
- Demographic trends (INEGI): Population growth, density shifts, and urbanization rates.
- Sectoral water consumption (CONAGUA): Domestic, agricultural, and industrial usage patterns.
Using Python (pandas, NumPy), we clean, model, and visualize trends to quantify demand growth. Matplotlib charts reveal consumption hotspots.
The goal is to support decision-makers by identifying consumption risks, projecting future demand, and evaluating whether current infrastructure can meet future needs.
Methodology
The project follows a structured, multi-phase methodology:
- Problem Definition:
Establishing the relationship between population growth and water demand in Queretaro. - Data Collection:
Acquiring population data from INEGI and water usage records from CONAGUA. - Data Cleaning and Organization:
Processing raw data using Python libraries (pandas and NumPy) to ensure analytical accuracy. - Descriptive Statistical Analysis:
Applying statistical methods to reveal trends and calculate metrics such as mean, median, and growth rates. - Visualization:
Creating graphs with matplotlib and seaborn to clearly communicate findings. - Website Development and Deployment:
Designing a responsive, policy-oriented website hosted on a VPS to ensure public access.
Each step is documented through technical reports, presentations, and digital formats, ensuring transparency and reproducibility.
Project Objectives
General Objective:
Develop a data analysis project on population growth and water availability in Queretaro, integrating programming techniques, data structures, and descriptive statistics.
Specific Objectives:
1. Deploy a responsive website on a VPS to disseminate results and promote informed decision-making.
2.Collect and validate historical population and water consumption data from INEGI and CONAGUA.
3.Clean and structure the datasets using Python libraries, ensuring analytical reliability.
5.Calculate descriptive statistics to quantify historical trends and inform sustainability targets.
6.Generate informative visualizations using matplotlib and seaborn for public and institutional engagement.
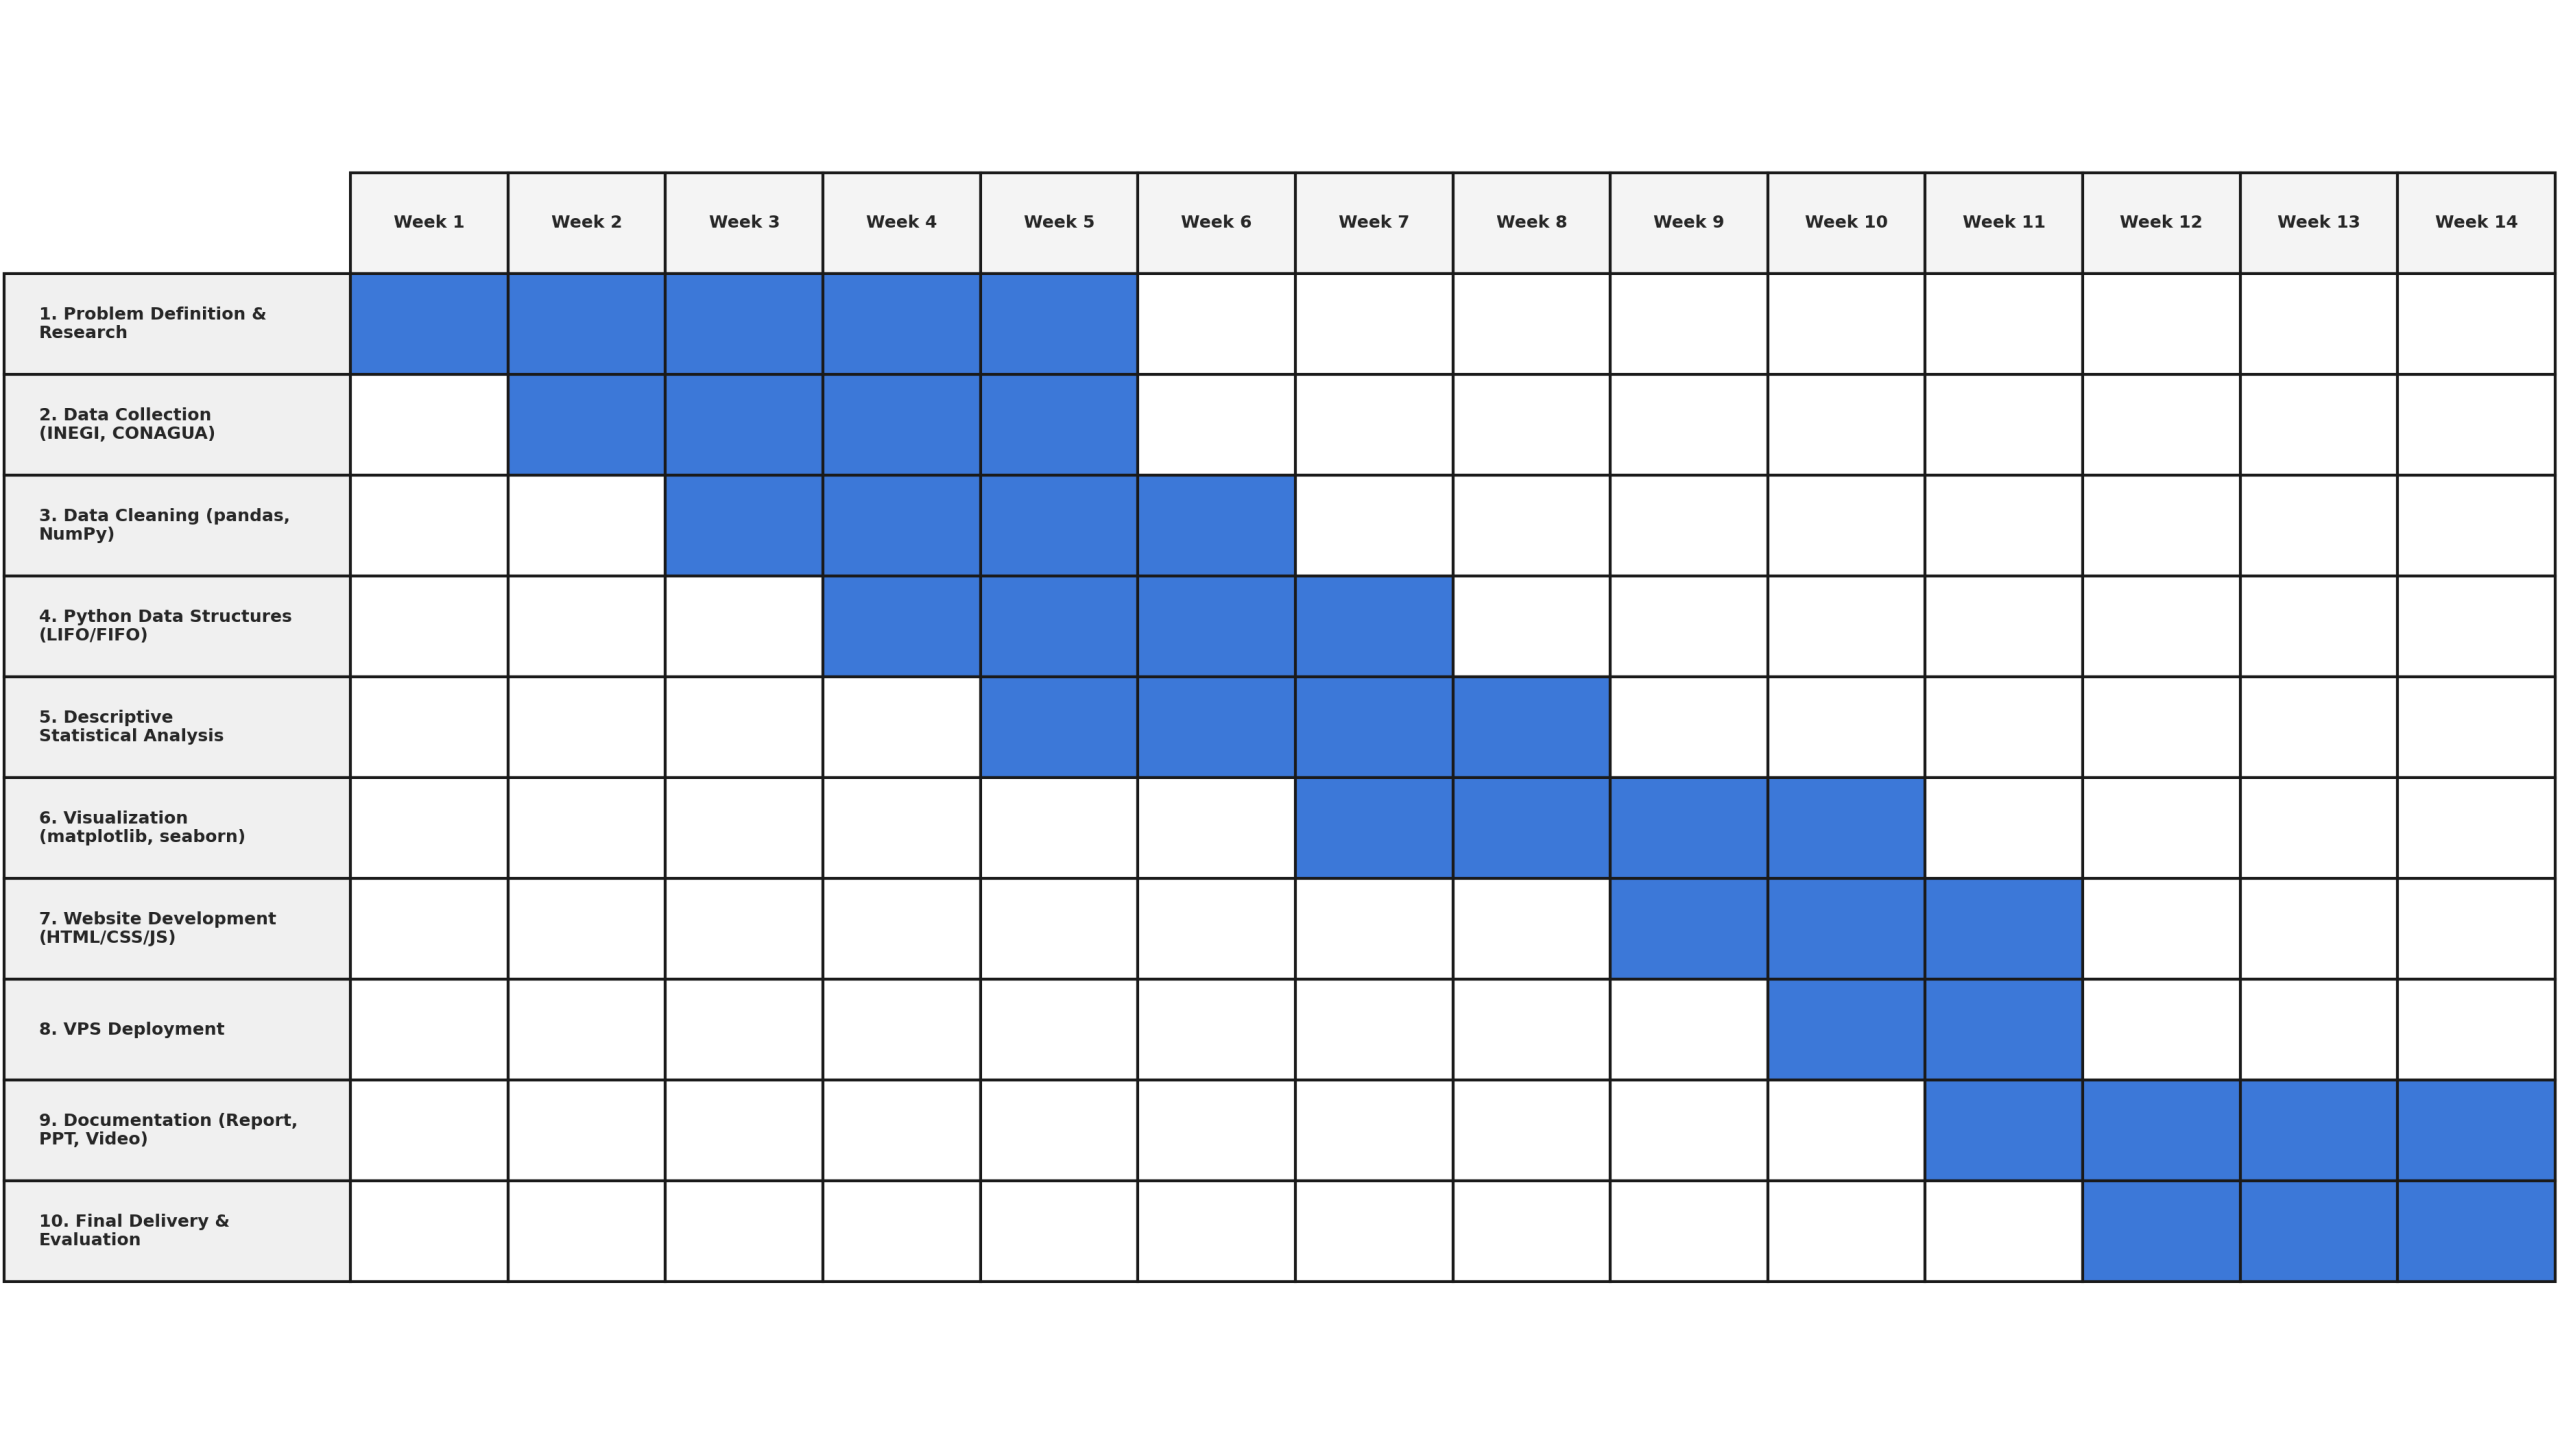
Project Timeline
Table 1 presents the Gantt chart for the project “Population Growth in Queretaro and Its Impact on Water Availability,” spanning 14 weeks and comprising ten sequential activities. The timeline begins with problem definition and preliminary research (weeks 1–5), followed by parallel data collection from INEGI and CONAGUA (weeks 2–5) and subsequent data cleaning. Water distribution modeling using stack (LIFO) and queue (FIFO) structures occurs in weeks 4–7.
Statistical analysis runs from weeks 5–8, transitioning to data visualization (weeks 6–9). Website development and VPS deployment take place during weeks 7–9 and 8–9, respectively. Documentation—including the report, presentation, and video—is developed in weeks 9–12. The project concludes with final evaluation and delivery in weeks 12–14.
This structure aligns with Bloom’s Digital Taxonomy and supports Sustainable Development Goals 6 and 11, as well as PRONACES Socio-environmental Systems, ensuring both methodological coherence and sustainability relevance.